Why a trader cares
Physical movement can confirm a price story, but vessel datasets also contain coverage gaps, stale destinations, and cargo uncertainty that must remain visible.
Physical Flows connects crude-on-water history with terrestrial AIS, vessel activity, tanker freight, LNG shipping, and explicit coverage quality.
Physical movement can confirm a price story, but vessel datasets also contain coverage gaps, stale destinations, and cargo uncertainty that must remain visible.
What movement is observable, and does it support or contradict the balance thesis?
Every screen preserves the instrument, period, unit, source, and limitation while explaining why the evidence matters.
Read the instrument, unit, timestamp, period, and source first. A weekly stock estimate and a five-minute futures quote answer different questions.
The current value matters less without its direction of travel, seasonal baseline, related markets, and the catalyst that moved expectations.
Treat every dataset as evidence with a release lag, methodology, revision risk, and known blind spots. The workflow should be reproducible after the fact.
Definitions stay plain enough to learn from, while the desk read preserves the mechanism, cadence, and source a professional user expects.
A daily estimate of crude barrels represented by covered vessels and the product's normalized movement logic.
Focus on the direction and persistence of the estimate, then test it against regional arrivals, freight, and reported trade.
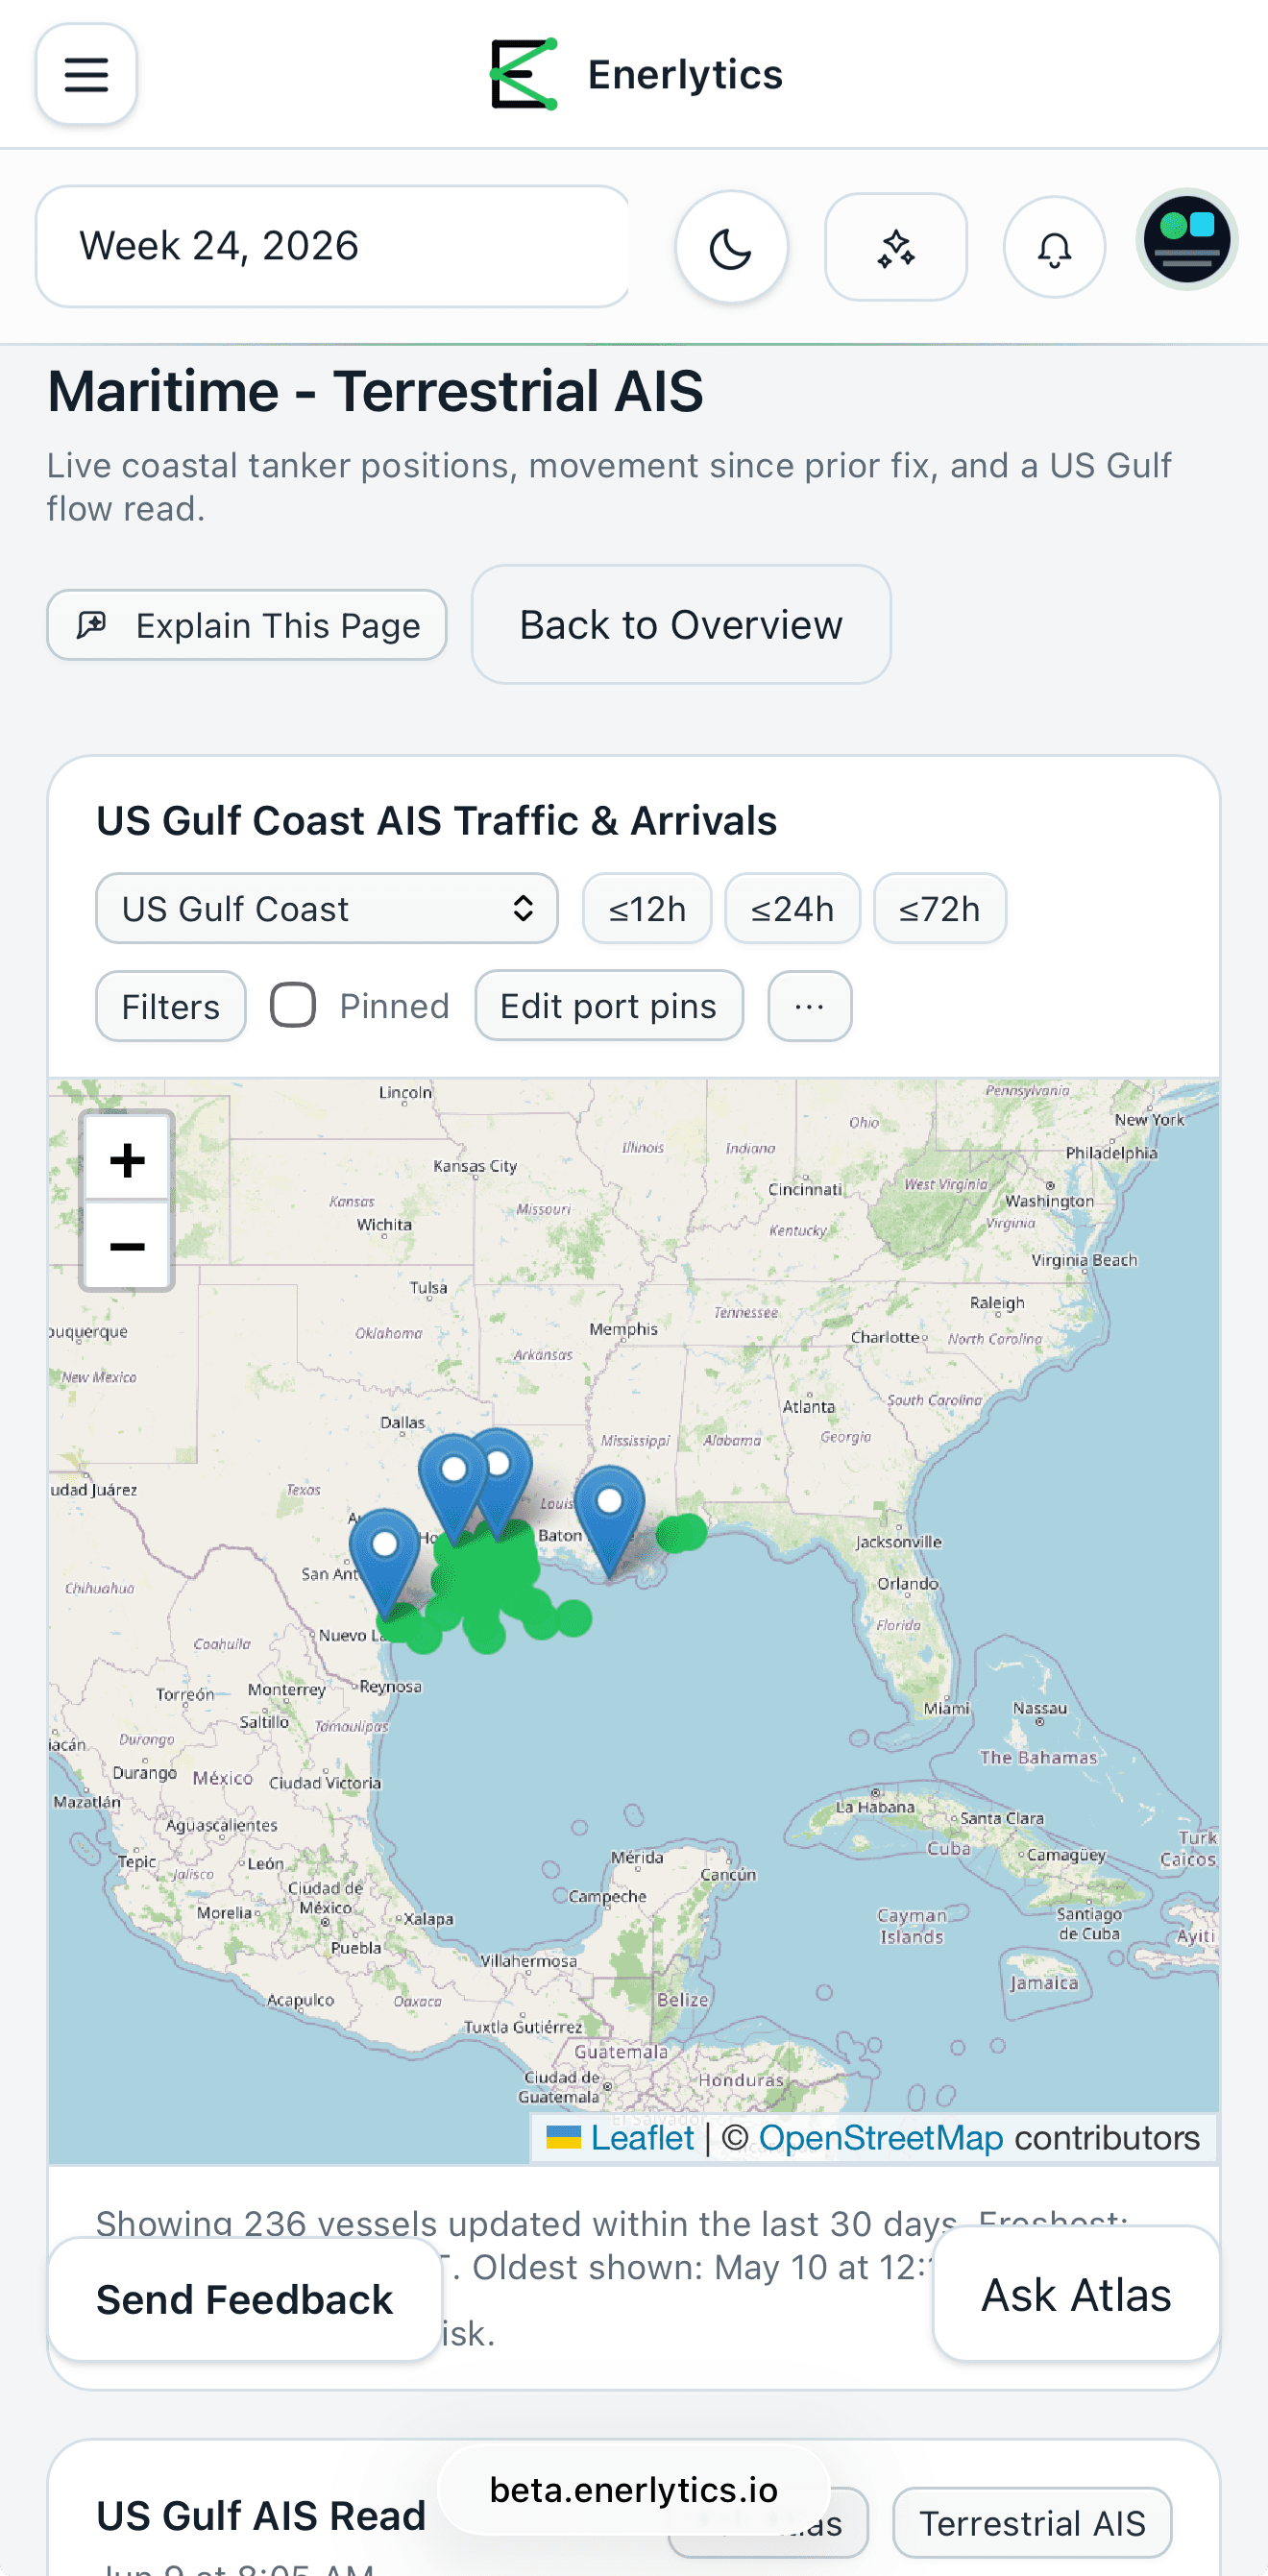
Covered tanker positions, movement states, regional counts, arrivals, and departures.
Vessel count alone ignores vessel class, load state, route, and coverage. Use it as observable traffic evidence, not exact cargo volume.
Gas-carrier categories and regional movements provide visible shipping context around export terminals and trade lanes.
Carrier activity complements feedgas and official export data; it does not directly measure liquefaction throughput.
TD3C and TD20 history adds route-level transport economics to visible tanker movement.
Price and vessels should be checked together: expensive freight without corresponding traffic can reflect risk or constrained tonnage rather than cargo demand.
Regional recency and observation density indicate whether the physical read is sufficiently observed.
A degraded status blocks the strongest inference from zero vessels or an abrupt drop in estimated barrels.
Separates observation from inferred cargo state
Uses regional and chokepoint context
Flags degraded coverage instead of treating an empty map as no activity
AIS is incomplete by construction. Satellite AIS remains coming soon, and inferred destination or cargo should not be treated as a verified bill of lading.
The product separates what was observed, what was inferred, and what could not be seen.
Check receiver freshness and regional observation density.
Review vessel class, track, arrival/departure state, and consistent time windows.
Measure crude-on-water or carrier trends without hiding classification uncertainty.
Compare freight, EIA trade, storage, LNG feedgas, and curve structure.
Position and timestamp are direct AIS fields. Cargo, destination, load state, and barrels-on-water can involve estimation and are labeled accordingly.
Older raw AIS is archived for cost control while bounded current-state summaries preserve the product workflow without repeatedly scanning the full history.
Enerlytics links the underlying methodology so customers can distinguish a product interpretation from the source definition.
Enerlytics publishes weekly market recaps, component explainers, and thesis walkthroughs. For Physical Flows, the recurring desk question is: Did observable vessel and freight behavior confirm the reported balance this week—or was coverage too weak to know?
Start with a free trial. Review the data, methodology, related evidence, and limitations before making your own market decision.
Start free trial